


Power BI Income Statement Template - configurable
| Configurable templates |
Key Features
- Configurable chart of accounts: Yes, via an external metadata spreadsheet
- £99 / one time
Short Description
An intuitive, flexible income statement that can work with your accounting data with some minor Power Query work and configuration of a metadata spreadsheet
Description
Specifications
-
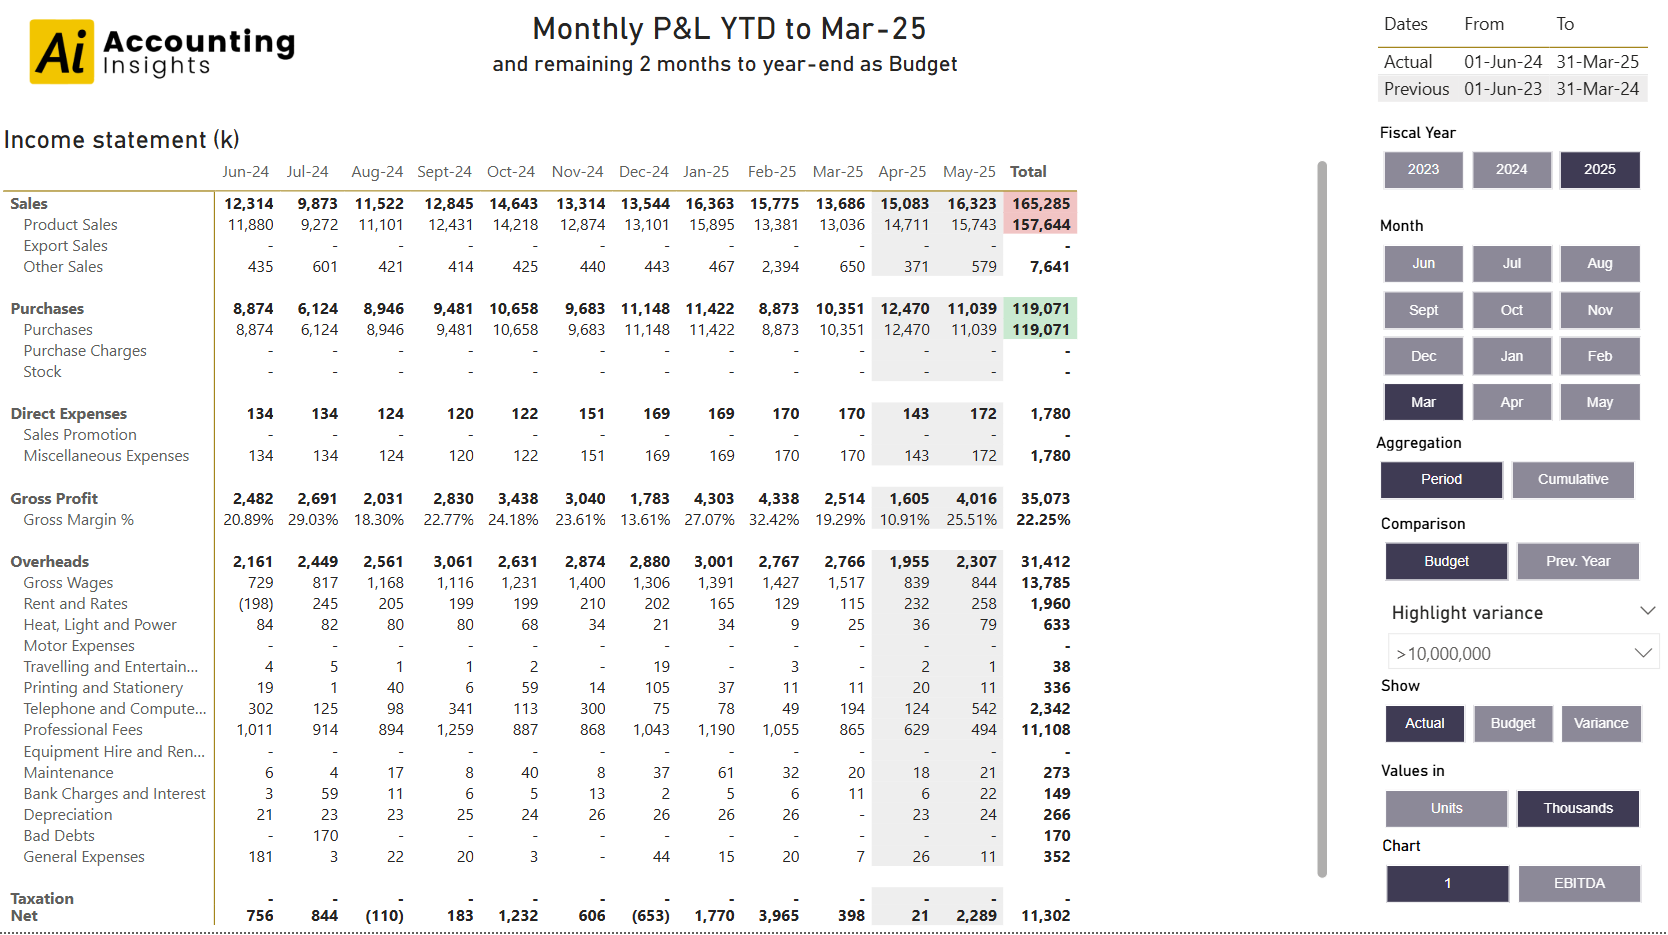
Topics covered
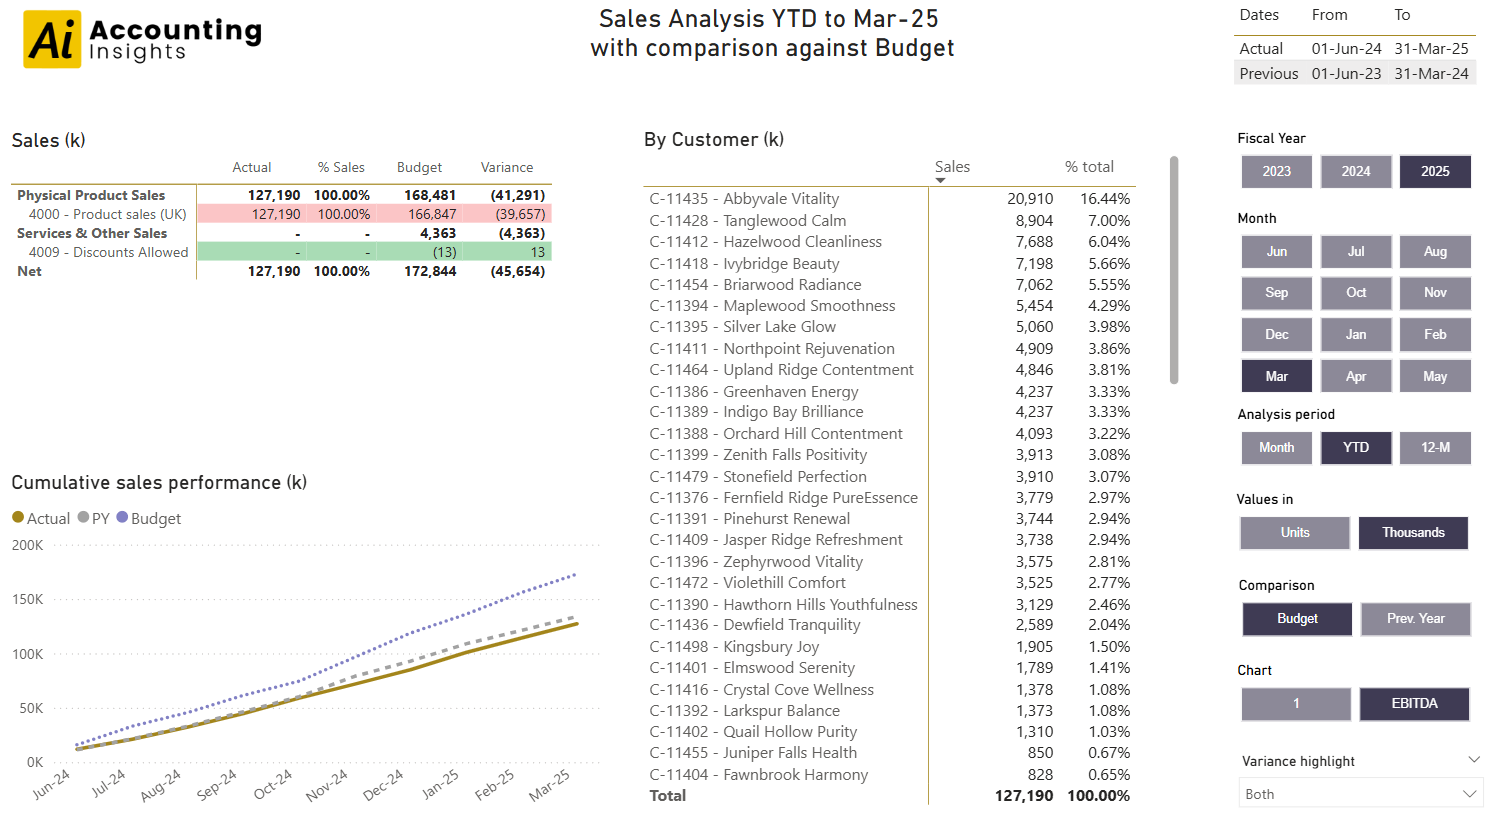
Income statement, actual vs budget/PY, sales, expenses
-
Simple, slicer-driven date range selection
Yes
-
Charts of Accounts
1, extendable via an Excel metadata workbook
Related Products