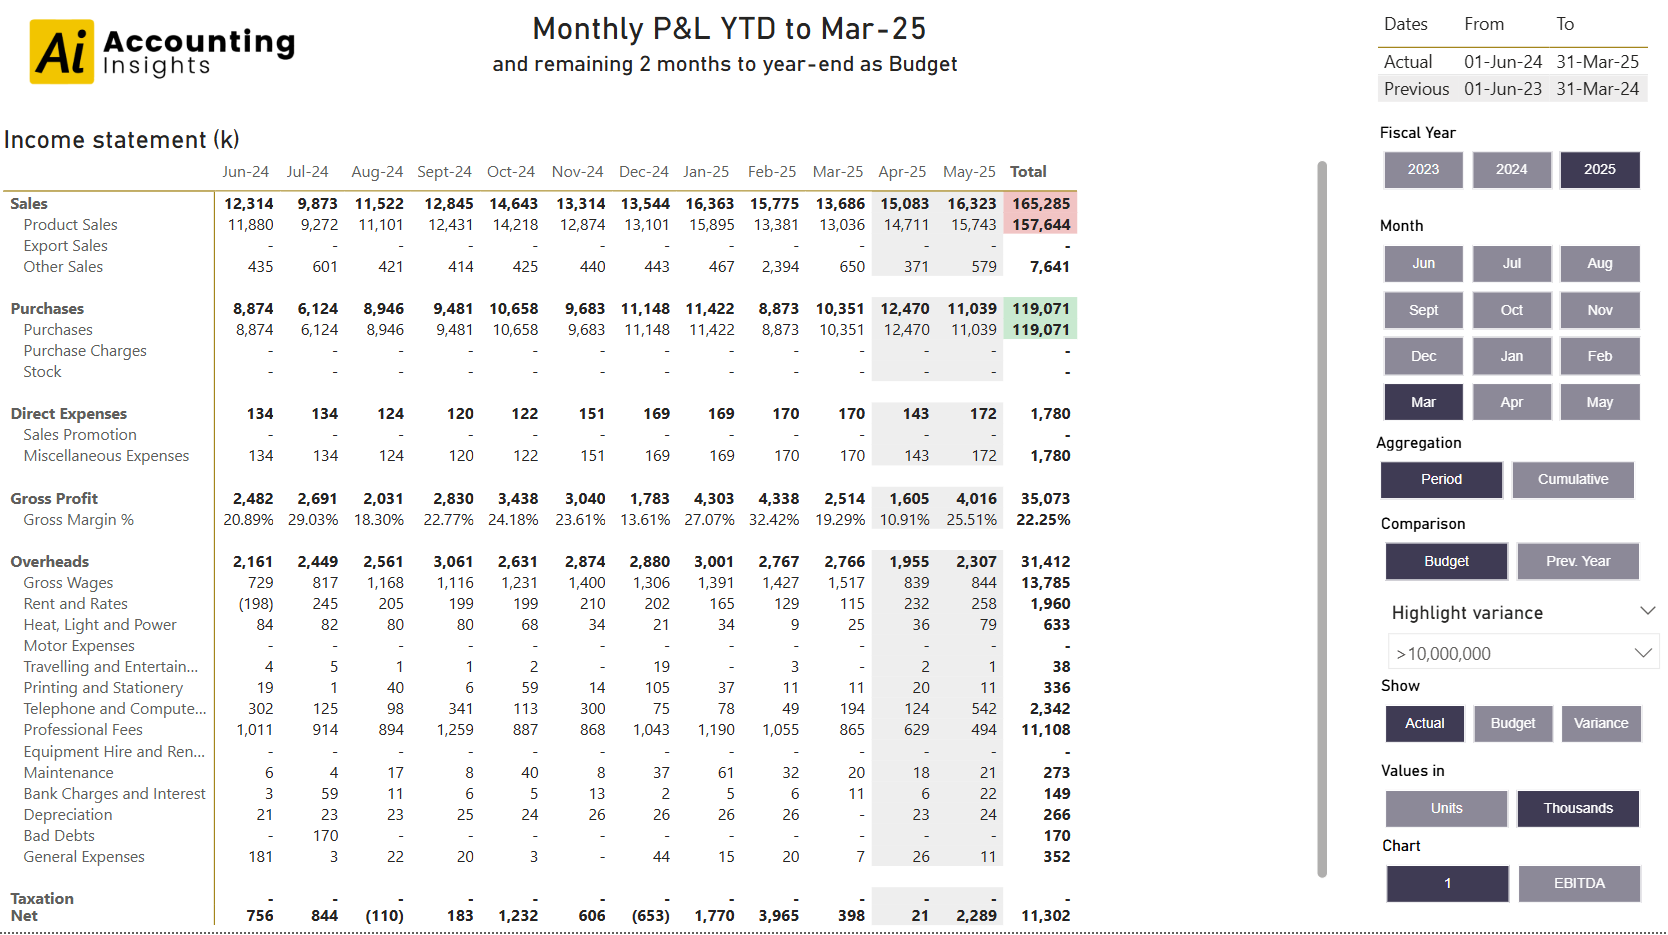
Fully-functioning Power BI Profit & Loss template with sample dataset (> 300k transactions) that is pre-transformed for use by the template.
Try the demo below:
The template is a .pbix file and Excel workbook with pre-transformed accounting data, which means that it is suitable for exploring a data model that is optimised for a P&L report and the use and construction of the various DAX measures in the report. The template is fully-working, and is the basis of numerous live projects.
Included features:
Six-page income statement report, as per the demo above, plus drill-through and transaction detail tooltip
Fully-working example of using DAX Dates Measures to provide simple, highly-intuitive selection of dates ranges by the user
Dynamic matrix columns, based on slicer selection (PY or Budget)
Budget/PY to Actual Bridge visuals
YTD-plus view with actuals YTD and the remainder as Budget/PY
Switch between different Charts of Accounts
Suitable for
This template is ideal for someone who wants to explore:
An optimised P&L Power BI data model
Using dates measures with disconnected tables for highly intuitive date range selection
A four-level Measures model comprising Base Measures, Calculation Measures, Presentation Measures and Filter Measures
Presentation possibilities around an Income Statement - all using standard, or free 3rd party visuals.
Not suitable for
In this basic template, the accounting data is provided already transformed and ready for use in the Power BI model. The template is therefore not well suited for adaptation to other accounting data sources and charts of accounts. The Generic and Accounts-specific versions of this template should be used if you want to adapt this to your own accounting data.
Topics covered
Income statement, actual vs budget/PY, sales, expenses
Simple, slicer-driven date range selection
Yes
Charts of Accounts
2
Configurable chart of accounts
No - this is available in the customisable versions of the template